mPATH Framework
mPATH Framework is an interactive analysis and visualization framework for behavior histories. In ubiquitous computing environment, it is possible to infer human activities through various sensors and accumulation of their data. Visualization of such human activities is one of the key issues in terms of memory and sharing our experiences, since it acts as a memory assist when we recall, talk about, and report what we did in the past. However, current approaches for analysis and visualization are designed for a specific use, and therefore can not be applied to diverse use. Our approach provides users with programmability by a visual language interface for analyzing and visualizing the behavior histories. The framework includes icons representing data sources of behavior histories, analysis filters, and viewers. By composing them, users can create their own analysis method of behavior histories. We also demonstrate several visualizations on the framework. The visualizations show the flexibility of creating behavior history viewers on the mPATH framework.
Features of the mPATH Framework
The following are features of the mPATH framework.
Component-based Architecture
For supporting programmability and reusability, we divided the method into several components and enabled development of an analysis method by combining several components like filtering data, counting data and classifying data.
Interactive Visual Programming
We provide data-flow visual programming interface to combine multiple analysis components. Structure of analysis method is shown visually and users can modify it by simple mouse operation. User's operation is immediately reflected to the system. Therefore users can easily develop original analysis method for a certain visualization.
Unified Behavior History Format
We defined unified internal data format of behavior history and geographic information. Since all internal data can be accessed by the unified way, we can easily reuse analysis method to various behavior history.
Visual Programming on mPATH Framework
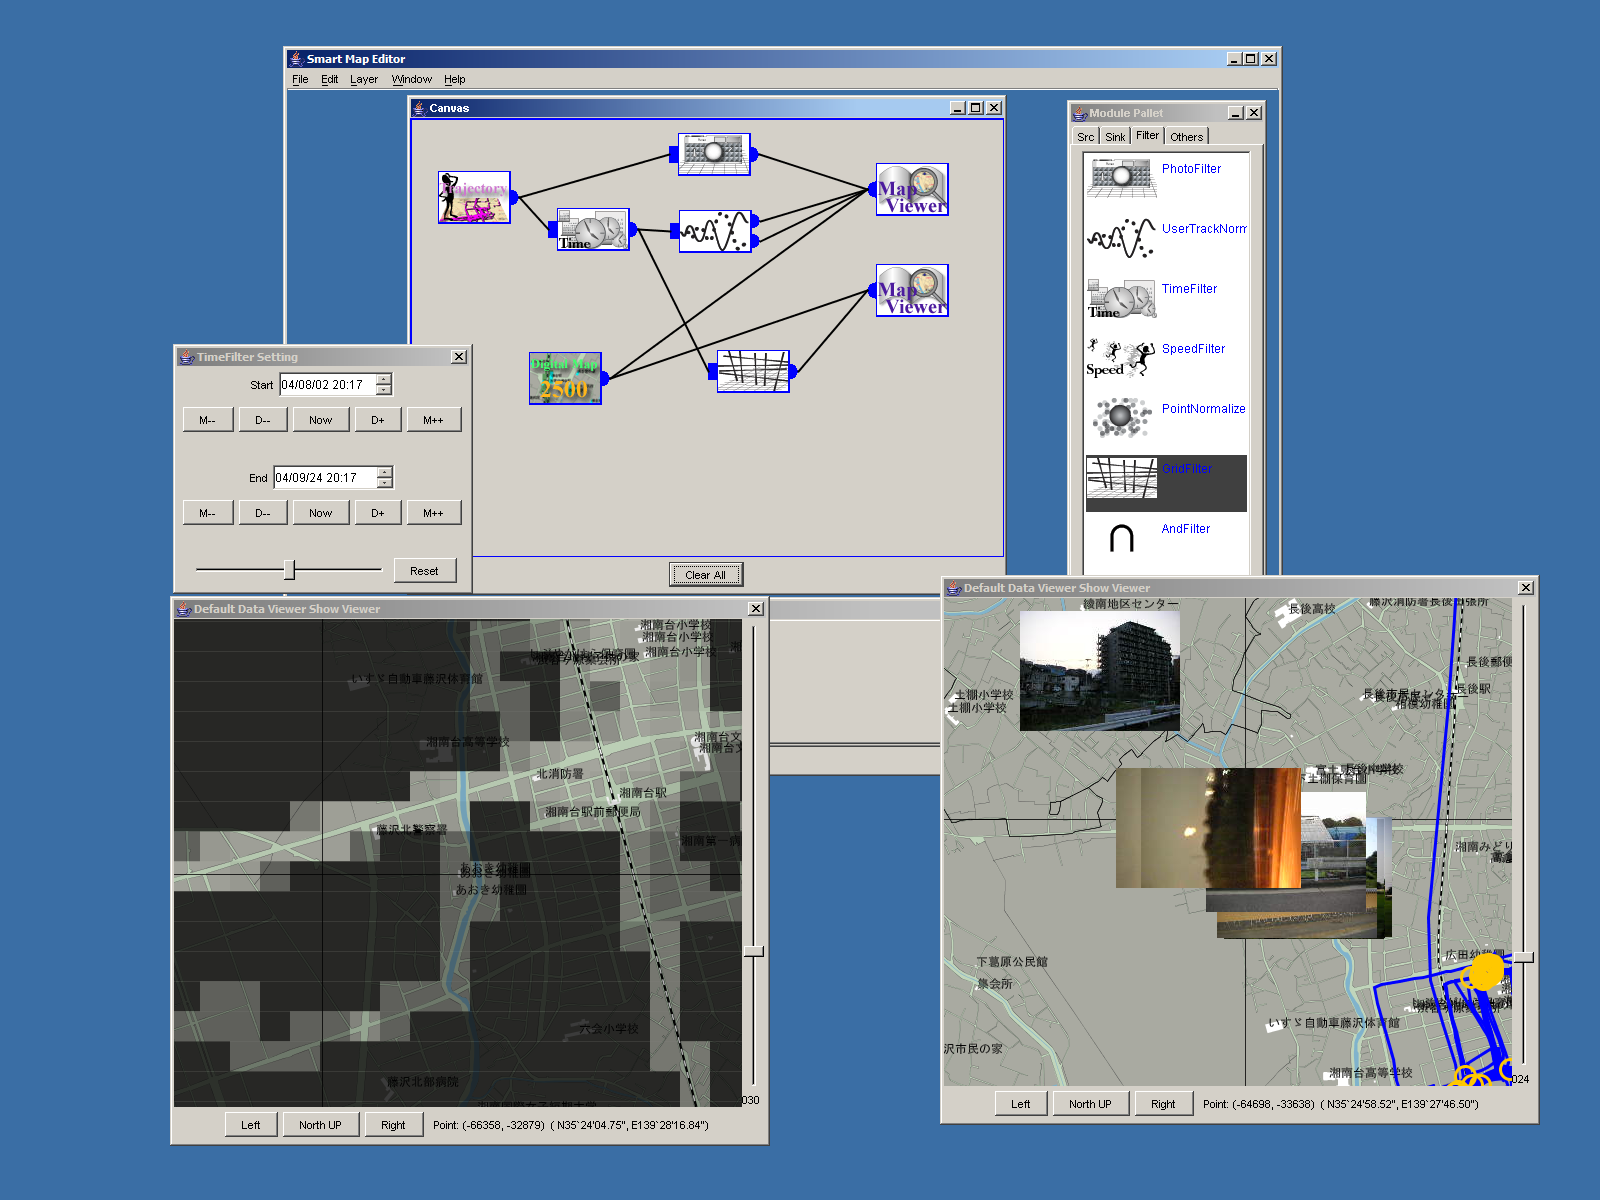
Visual programming interface both shows current internal status visually, and accept user's operation to change the status. On the interface, procedure of visualizing data is shown as a collection of icons connected by lines on which data are flowing from the left to the right. An icon at the starting point of the line shows raw data captured by a sensor, and an icon at the end point shows a final visualization method. Icons on the line named mPATH module show analysis methods of data.
Users can interactively register and delete icons on the programing interface, and connect and disconnect icons by mouse operation. When the command executed successfully, the visual on the interface changes immediately. A user can access detail of each icon by clicking right button. It provides menu to access internal parameter, and a visualization window itself.
We classified mPATH modules into input, filter, and output modules. Input modules have only output ports, and output modules have only input ports. Filters have both, and output processed data acquired from input ports. We developed following mPATH modules for demonstration.
Input Modules
| GPS Movement Module | |
|---|---|

| We implemented a mPATH Module of movement data acquired by a handy GPS. With this module, we can input movement data captured by Garmin eTrex from local files. We can also input real time movement data from a GPS receiver of NMEA-0183 style through RS-232C port. |
| Digital Photo Module | |

| We implemented a mPATH module of digital photo. This module deals with jpeg files as behavior histories of ``taking pictures'' by reading time stamps and location in EXIF area. In addition, by matching timestamps of photos with movement data, it estimates location where the photos were taken without location information. |
| Vector Map Module | |

| We implemented a module of map data in vector format. There are several popular map format for GIS like Shape format for ArcGIS and the format of the Geographical Survey Institute of Japan. These map contains points of station, lines of road, polygons of buildings, and so on. Users can infer a detail of behavior with information of real world by using map data as well as behavior data in the system, and also use the map as a background of visualization. |
Filter Modules
| Time Filter | |
|---|---|

| Time filter extracts behavior histories within a specified term. |
| Speed Filter | |

| Speed filter filters data by its speed. It is useful especially to infer transportation from movement data. |
| Waypoint Filter | |

| Waypoint filter classifies GPS point data into movements and stops. Users can change threshold of time to detect the user's stop. |
| Matching Filter | |

| Matching filter joins two input data according to location. When we input one from the map data and the other from waypoints data, this filter adds name of places to each waypoint. |
| Count Filter | |

| Inside the count filter, geographical regions are divided into a grid. The filter counts input data in every grid. Users can learn how many times he or she visited a certain point, i.e. a weight of the point, in behavior history. |
Output Modules
| Normal Map Viewer | |
|---|---|

| To visualize spatial aspect of behavior history, we developed normal map viewer. In this viewer, every input is ordered by the geographic coordinates, so that generic map-like visualization is realized. This viewer accepts multiple data and overlays them. |
| Table Viewer | |

| We developed table viewer to show details of data by characters and figures. This viewer lists every input data, so that it is useful especially for developing analysis method. |
| Weight Map Viewer | |

| Weight Map Viewer shows weights of each geographical region visually in addition to normal map. There are several ways to visualize weights of regions such as colors of a map, scale of a map, or distortion of a map. In current implementation, we use scale of each regions to show weights. |
Example of the Programming
Video 1 demonstrate the example of the programming on the mPATH framework. On the demonstration, we analyzed Ito's GPS data. Firstly, we showed the GPS data on the map, then separated into the movement and the waypoint. Finally we extracted the data of the certain date.
Publications
- Masaki Ito, Jin Nakazawa, and Hideyuki Tokuda, “mPATH: A Software Framework for Interactive Visualization of Behavior History,” Journal of Mobile Multimedia, Vol.1. No.3, pp 255–269, 2005.

- Masaki Ito, Jin Nakazawa, Hideyuki Tokuda, "Software Architecture for Map-based Services in Ubiquitous Computing Environment," MOBILE MAPS 2005, In combination with MobileHCI 2005, Salzburg, Austria, Sept., 2005.
- Masaki Ito, Yuu Furuichi, Jin Nakazawa, Hideyuki Tokuda: mPATH View: An Interactive Behavior History Viewer for Enhancing Communication, Adjunct Proceedings of the Third International Conference on Pervasive Computing (Pervasive 2005 Demonstrations), pp.93--96, Munich, Germany, May 2005.
- Masaki Ito, Jin Nakazawa, Hideyuki Tokuda: "mPATH: An Interactive Visualization Framework for Behavior History," The IEEE 19th International Conference on Advanced Information Networking and Applications (AINA2005), pp.247--252, March, 2005. Highly Commended Paper Award
- Masaki Ito, Jin Nakazawa, Hideyuki Tokuda: A Framework for Personalizing Action History Viewer, Pervasive 2004 Workshop on Memory and Sharing of Experiences, pp.87-94, April, 2004.